


Highlighting variation in hospitals medicines usage
- Posted:
- Written by:
-
- Chris Wood,
- Louis Fisher,
- Steve Black,
- Brian MacKenna
- Categories:
This article is part of a series: OpenPrescribing Hospitals: Measures
- Introducing OpenPrescribing Hospitals measures
- Highlighting variation in hospitals medicines usage
- Low value medicines in OpenPrescribing Hospitals
In a previous blog we introduced OpenPrescribing measures. We described how they are created and how they can be used to identify deviations from best practice standards, but explained that it is not always obvious what “good” is. In this blog we will look at how we can contextualise the data for individual organisations by comparing them to others as part of the OpenPrescribing Hospitals Measures feature.
Percentiles charts show variation in practice

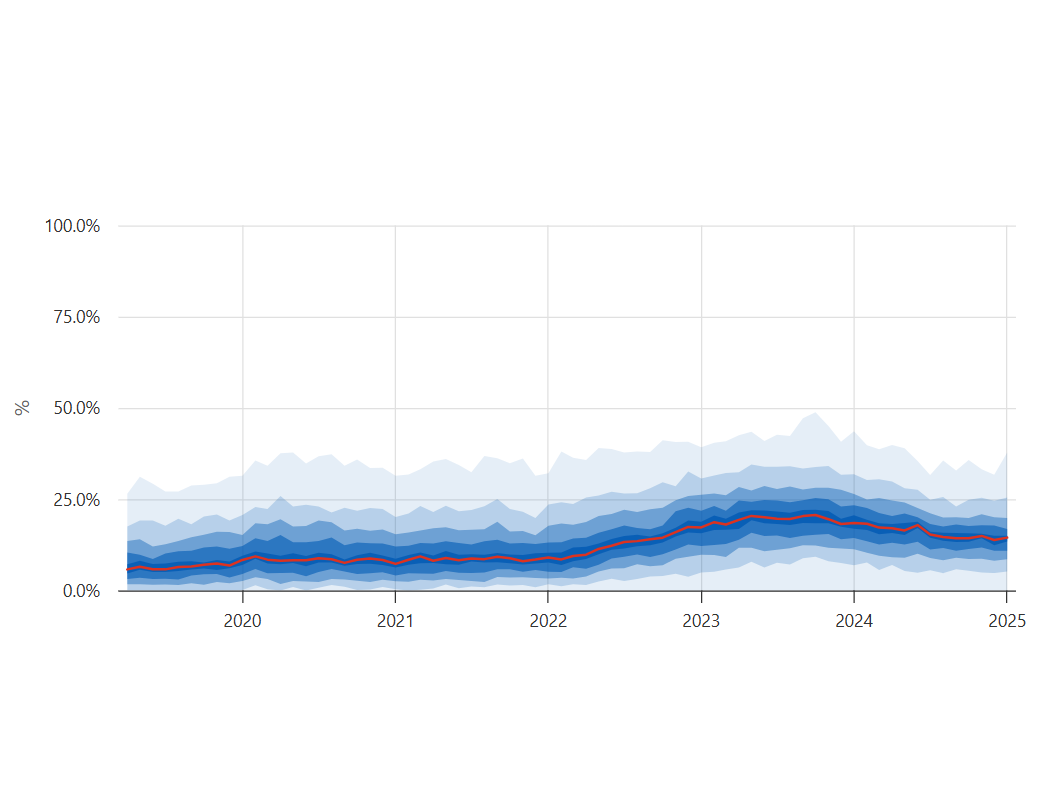
When you initially load an OpenPrescribing Hospitals measure you will be presented with a percentile chart, like in the figure above. This shows percentile ranges for the percentage of Direct Oral Anticoagulants (DOACs) not prescribed as rivaroxaban or apixaban tablets measure across NHS trusts in England. The aim of this chart is to show, at a glance:
- How much variation there is across NHS trusts
- How an individual trust compares to their peers
We have explained in a previous blog why we think this is the best way to present the data in OpenPrescribing.net and the same principles apply to the data used in OpenPrescribing Hospitals.
Let’s have a look at how we can interpret the chart above.
Key chart elements:
- The red line represents the national median (50th percentile). You can find this value by ordering trusts by their value for a given measure and picking the middle value. 50% of trusts have a value above this and 50% have one below.
- The blue shaded areas represent the variation across trusts around the median. Each shaded area represents a different range of percentiles. For example:
- 5th-95th percentiles - This range covers 90% of NHS trusts (from the 5th percentile to the 95th percentile). This wide range helps highlight outliers and extreme variations in prescribing.
- 25th-75th percentiles - This range covers 50% of NHS trusts, showing the middle ground of prescribing. This is a useful range for identifying what might be considered “normal” prescribing behaviour.
Why Percentiles Matter
The wider the percentile value ranges, the more variation there is in prescribing habits across NHS trusts. A narrow spread suggests more consistency in usage. Looking at extremes helps to identify outliers that may require further investigation. Focusing on central ranges (25-75th percentile) gives a clearer view of what is “typical” practice.
An example from OpenPrescribing Hospitals
If you work in or with a specific NHS trust you will likely want to see how it compares to national trends. You might also want to include other suitable comparator trusts. On OpenPrescribing Hospitals, we provide a way to select individual trusts to overlay on a percentile chart.

Below is an example for the trusts selected above. We can see, for this measure, these trusts have a similar pattern.

For now, we don’t make any recommendations of suitable trusts for comparison. We leave this grouping up to our users as they likely have the best ideas on who their peers are. For example, if reviewing a large cancer focused trust, you are likely aware of other similar large cancer focused trusts you would want to compare against.
If you hover over the chart you will be able to see specific monthly data points, including the numerator and denominator values where applicable, which gives an idea of the scale of usage beyond the relative usage for the measure.

Surfacing variation and other geographical levels
There can also be interesting varaition in medicines usage at different geographical levels. As well as trust level patterns, OpenPrescribing Hospital Measures also support viewing the national trend and breakdowns by Integrated Care Boards (ICBs) and NHS regions. Below is an example of the measure shown above for a selection of NHS regions.

Get started with measures
The OpenPrescribing Hospitals Measures feature is now now live on our website. You can get started at: https://hospitals.openprescribing.net/measures/. We have intially made a small number of measures available but will be adding more soon.
Let us know your thoughts
Your feedback is extremely valuable to us, especially at this early stage.
- Have you discovered something new or unexpected using our measures?
- Do you have any comments or feedback on the measures on how we can improve?
- Do you have any suggestions for additional measures?
Expect to see new measures, features and functionality in the coming weeks and months based on your feedback.
Please share any comments or feedback with us via email. We would also be happy to join short calls, team meetings etc if you would prefer to give feedback in this manner.